
I found under ubuntu my frame rates started around 200+ but as soon as the game started and anything interesting was spawned say my first mex, or I zoomed out, my frame rate plummeted to around 10-40fps.
Testing later under the new Vista install showed similar behaviour. All under 0.75b2 though. I'm waiting for the new vclibs package before I test the new changes though.
Framerate, after glGet changes
Moderator: Moderators

Which driver version and card do you have under ubuntu? IIRC ubuntu's nvidia drivers are a bit behind and there were some pretty massive enhancements on the latest nvidia driver for 8000 series cards.AF wrote:I found under ubuntu my frame rates started around 200+ but as soon as the game started and anything interesting was spawned say my first mex, or I zoomed out, my frame rate plummeted to around 10-40fps.
Testing later under the new Vista install showed similar behaviour. All under 0.75b2 though. I'm waiting for the new vclibs package before I test the new changes though.
Last edited by kujeger on 28 Nov 2007, 22:54, edited 1 time in total.


It's not quite that bad for me, but closeAF wrote:I found under ubuntu my frame rates started around 200+ but as soon as the game started and anything interesting was spawned say my first mex, or I zoomed out, my frame rate plummeted to around 10-40fps.
Testing later under the new Vista install showed similar behaviour. All under 0.75b2 though. I'm waiting for the new vclibs package before I test the new changes though.
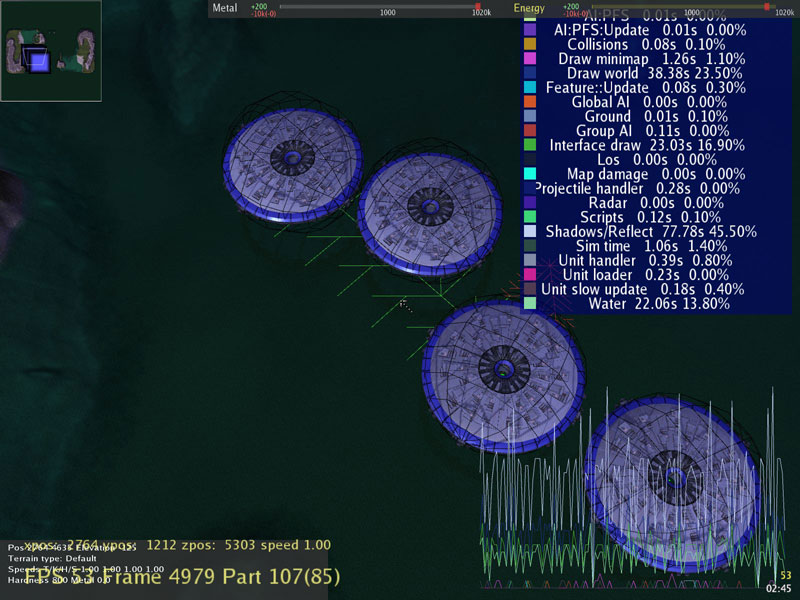
Well, here are my results. Not what I was hoping, but very, very interesting nonetheless- I didn't realize that most of the CPU usage is now interface draw, when everything else reaches a non-changing state. It only becomes drawing-related tasks when all of the bells and whistles are fired up.
And you can see the "spikes" caused by the frame-updates quite clearly, now that we know what we're looking for.
It'll be really interesting if the other two glGets are removed, to see what happens. When the GPU load is going up, in the first two tests, the new build is ever-so-slightly faster. I really wonder, frankly, how much of this is being caused by shaders executing CPU-side, when they should properly be GPU-side, because of the stark contrast with the "low" setting tests.
But my theory that a lot of this is being caused by load-balancing might not be totally insane, after all- when I subtract out all of the noise, you can see my CPU ticking to almost 50%, 30 times a second. If we went to different timing model, we might be able to make more efficient use of CPU time- it looks to me like Spring is spending a lot of that 1/30th of a second doing absolutely nothing, CPU-wise, after a huge amount of activity.
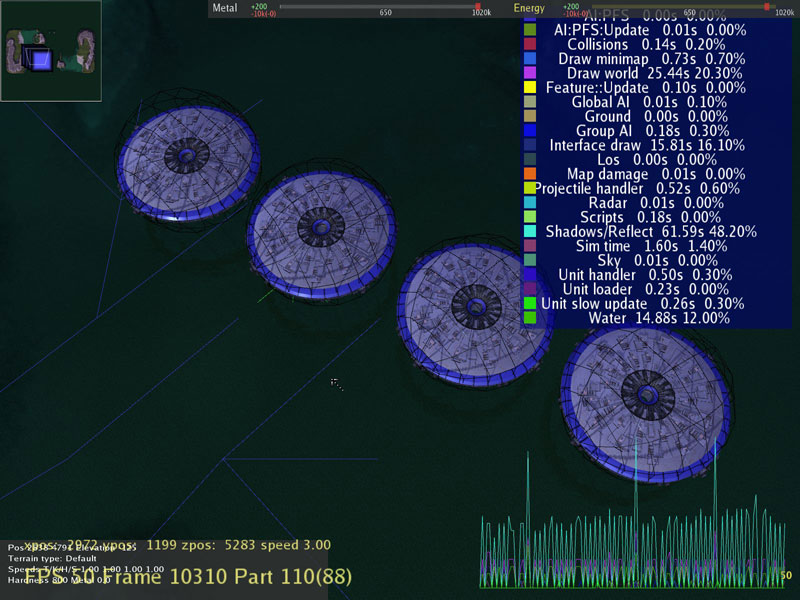
Maxed out, aside from dynamic water.

0.75b2:
Build 4888:
Note that one GIANT spike in CPU in 4888. Seems to happen every SlowUpdate. My guess is it's an interface element with something slightly un-optimized.
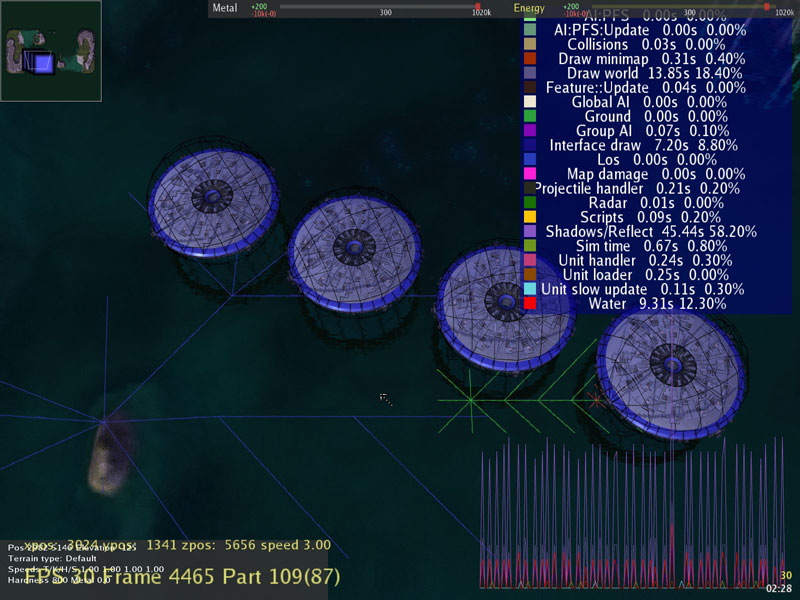
Medium settings, close to what I like to play with:

0.75b2:
Build 4888:
Note the weird hill / valley pattern of CPU usage for shadow / reflect for 4888. WTF? Is the water shader creating whole new sets of polygons, and the number isn't the same per frame, irregardless of view-distance? I didn't move the camera for several seconds before each shot, and nothing else is happening within the sim, so something's odd there...
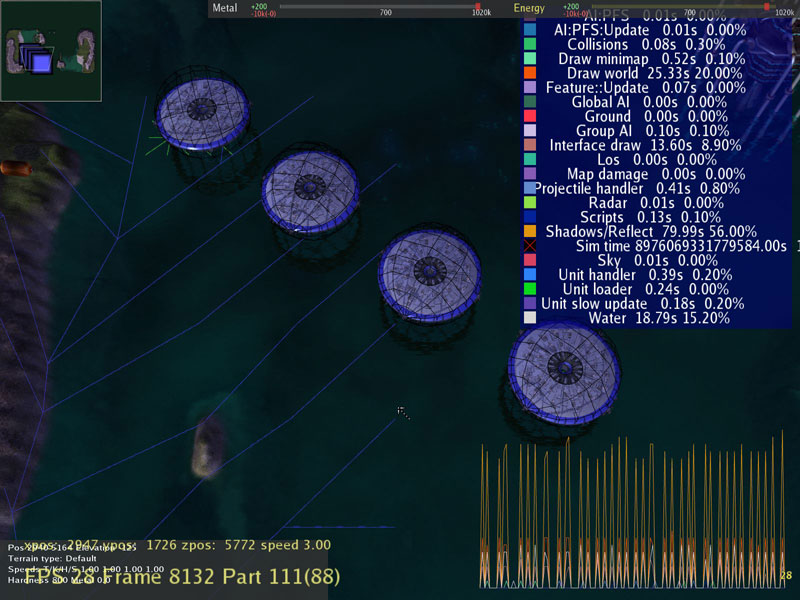
Aggressive settings for serious play:

0.75b2:
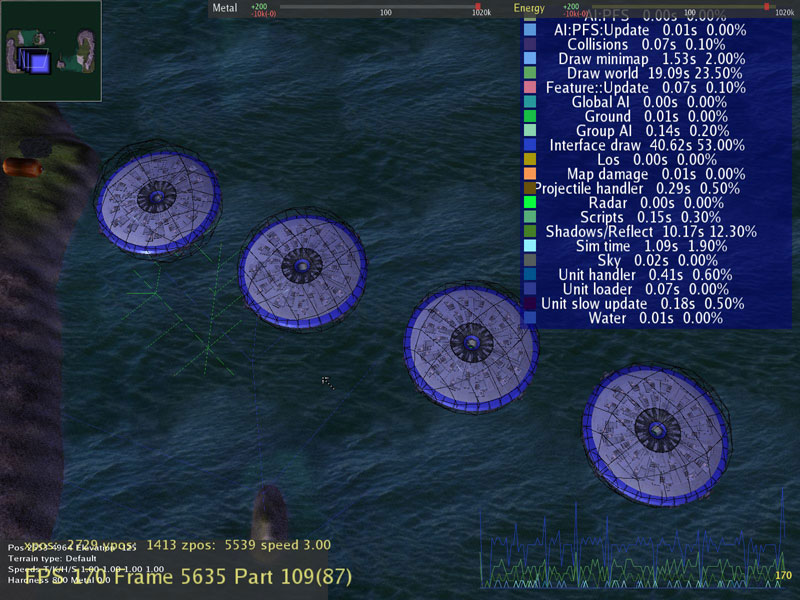
Build 4888:
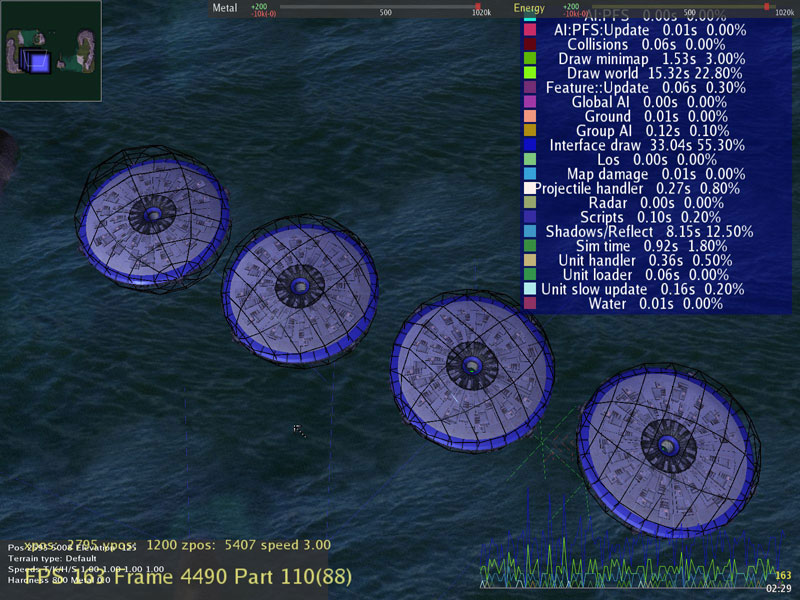
Hmm, something odd there. It appears that 4888 is drawing significantly less CPU in a variety of areas than 0.75b2, yet FPS is lower. I don't see why this would be the case, since I don't really see a lot in the changelog that indicates any major tasks have been shifted from the CPU to the GPU for this build of Spring. What I'll need to test, later on, is whether these figures, which are pretty good when all together (looks like about 10%) translate into real performance differences, when there are a lot events occuring that demand a lot of CPU...
And you can see the "spikes" caused by the frame-updates quite clearly, now that we know what we're looking for.
It'll be really interesting if the other two glGets are removed, to see what happens. When the GPU load is going up, in the first two tests, the new build is ever-so-slightly faster. I really wonder, frankly, how much of this is being caused by shaders executing CPU-side, when they should properly be GPU-side, because of the stark contrast with the "low" setting tests.
But my theory that a lot of this is being caused by load-balancing might not be totally insane, after all- when I subtract out all of the noise, you can see my CPU ticking to almost 50%, 30 times a second. If we went to different timing model, we might be able to make more efficient use of CPU time- it looks to me like Spring is spending a lot of that 1/30th of a second doing absolutely nothing, CPU-wise, after a huge amount of activity.
Maxed out, aside from dynamic water.
0.75b2:
Build 4888:
Note that one GIANT spike in CPU in 4888. Seems to happen every SlowUpdate. My guess is it's an interface element with something slightly un-optimized.
Medium settings, close to what I like to play with:
0.75b2:
Build 4888:
Note the weird hill / valley pattern of CPU usage for shadow / reflect for 4888. WTF? Is the water shader creating whole new sets of polygons, and the number isn't the same per frame, irregardless of view-distance? I didn't move the camera for several seconds before each shot, and nothing else is happening within the sim, so something's odd there...
Aggressive settings for serious play:
0.75b2:
Build 4888:
Hmm, something odd there. It appears that 4888 is drawing significantly less CPU in a variety of areas than 0.75b2, yet FPS is lower. I don't see why this would be the case, since I don't really see a lot in the changelog that indicates any major tasks have been shifted from the CPU to the GPU for this build of Spring. What I'll need to test, later on, is whether these figures, which are pretty good when all together (looks like about 10%) translate into real performance differences, when there are a lot events occuring that demand a lot of CPU...


Yeah, its a mix between those two. Its considered non-standard due to its illogical double negative with the prefix and suffix ir- and -less. It is listed in some dictionaries though (as non-standard), only because its used quite often. I even catch myself using it in speech sometimeskujeger wrote:You're (both) probably confusing "regardless" and "irrespective" (or some other irr- word). "Irregardless" isn't a word.Snipawolf wrote:Interesting. Very nice work, guys, perhaps the next version of Spring will be a lot faster. That would be awesome.
Also, irregardless.
On topic:
Woot, improved performance for 8*** series!
-
Auswaschbar
- Spring Developer
- Posts: 1254
- Joined: 24 Jun 2007, 08:34
You should not take the graph or the percentage too seriously. When everything is at 0 it doesn't mean CPU is doing nothing, it only means there have been no timer events.And you can see the "spikes" caused by the frame-updates quite clearly, now that we know what we're looking for.
PS.: Does anyone knows a good VTune tutorial (for linux)? I have just downloaded the noncommercial version and want to try to run spring with it...